Canada has recently earned the title of “food inflation capital” of the G7, after food prices rose 6.2 percent in 2025 alone. In response, Prime Minister Carney recently introduced the Canada Groceries and Essentials Benefit (CGEB) rebate (an expansion of the existing GST/HST rebate) targeted at low-income earners.
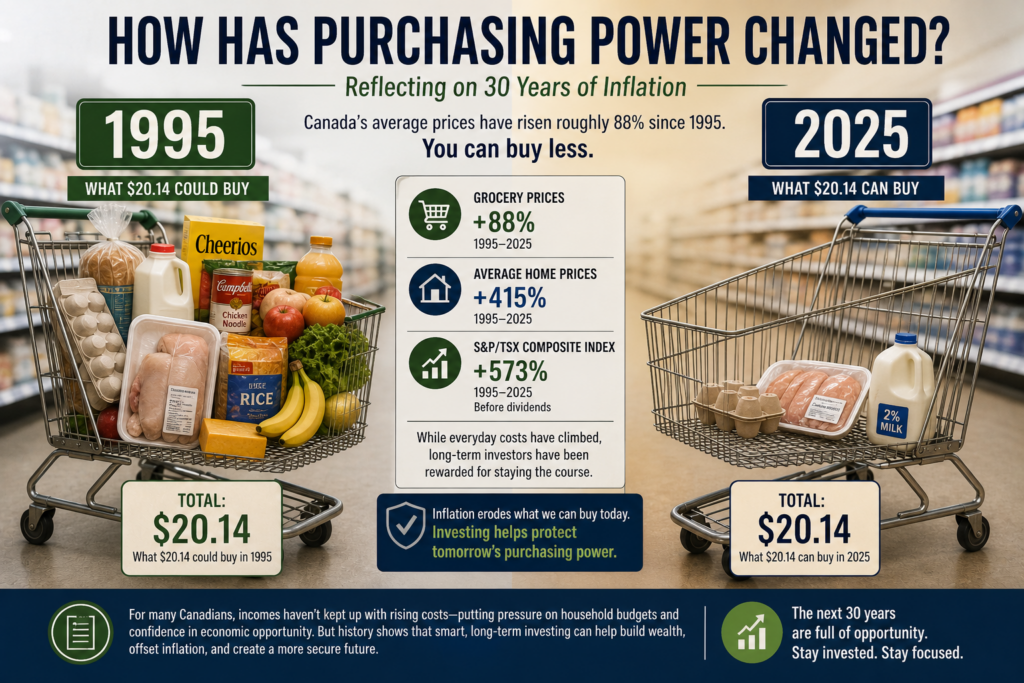
Many of us have noticed how quickly grocery bills have risen in recent years. It’s hard to believe a kilogram of chicken once cost $3.75 and a carton of eggs just $1.60…but that was 1995. While the Consumer Price Index (CPI), the federal government’s official measure of inflation, shows average prices have risen roughly 88 percent over three decades, your grocery bills probably tell a very different story (chart).
Inflation becomes especially troubling when incomes fail to keep up. For a growing portion of the population, this is the reality. When expenses, especially those like education and housing, become harder to afford, the impact is not just financial; it can influence confidence in economic opportunity and heighten social divides.
While household affordability has come under increasing pressure, long-term investment performance tells a different story. Throughout the same period, investors have seen the S&P/TSX Composite Index rise more than 573 percent, even before accounting for reinvested dividends. That growth has outpaced the price increases across every category on the chart, including average home prices during a prolonged housing boom.
Of course, this growth did not come without volatility, including four bear markets spanning a combined 40 months, two of which saw declines of more than 45 percent. Still, for those who stayed the course, equities have proven to be one of the most effective tools for building wealth and offsetting inflation over the long run. If history is any guide, that’s encouraging news for long-term investors looking ahead to the next 30 years.
Changes in (Nominal) Prices of Select Items: 1995 & 2025
| 1995 | 2025 | Change | |
| Ground Beef (1 kg)1 | $3.80 | $15.54 | +309% |
| Chicken (1 kg, breast)1 | $3.75 | $15.19 | +305% |
| Eggs (1 dozen)1 | $1.64 | $4.74 | +189% |
| Coffee, Roasted (300g)1 | $3.86 | $8.25 | +114% |
| Oranges (1 kg)1 | $2.30 | $4.46 | +94% |
| Unleaded Gas (Reg, c/L)2 | 52.4 | 137.0 | +161% |
| Consumer Price Index3 | 88.01 | 165.4 | +88% |
| University Tuition (Undergrad)4 | $2,384 | $7,734 | +224% |
| Cdn. Family Income (Median)5 | $41,343 | $130,120 | +215% |
| CMHC Median Home Price6 | $170,000 | $740,000 | +335% |
| S&P/TSX Composite Index7 | 4,661.18 | 31,382.80 | +573% |
- Statistics Canada, Table: 18-10-0002-01 (November 1995 data); Table: 18-10-0245-02 (November 2025 data); 2. Table: 18-10-0001-01, November 1995 & 2025; 3. https://www.bankofcanada.ca/rates/price-indexes/cpi/; 4. https://www150.statcan.gc.ca/t1/tbl1/en/tv.action?pid=3710004501
- https://open.canada.ca/data/en/dataset/cf5a0c30-8893-11e0-b0f5-6cf049291510; Stat Can T-1110019101 for 2025, $121,000 (2023) with 3.6% (2024) & 3.8% (2025) wage growth assumptions; 6. CMHC New Build Median Price; https://www.cmhc-schl.gc.ca/professionals/housing-markets-data-and-research; 7. At close 11/30/95 and 11/28/25.
The comments contained herein are a general discussion of certain issues intended as general information only and should not be relied upon as tax or legal advice. Please obtain independent professional advice, in the context of your particular circumstances. This newsletter was written, designed and produced by J. Hirasawa & Associates for the benefit of Chuck Magyar who is a Portfolio Manager for iA Private Wealth and does not necessarily reflect the opinion of iA Private Wealth.